

The GEO illusion created by SoV
A big-data GEO research case. Even with the same top 5 AI citation sources, visibility differed 30x. We analyze, with a real case, what causes the GEO illusion that small data creates and how a big-data diagnosis leads to an optimization strategy.
Chris
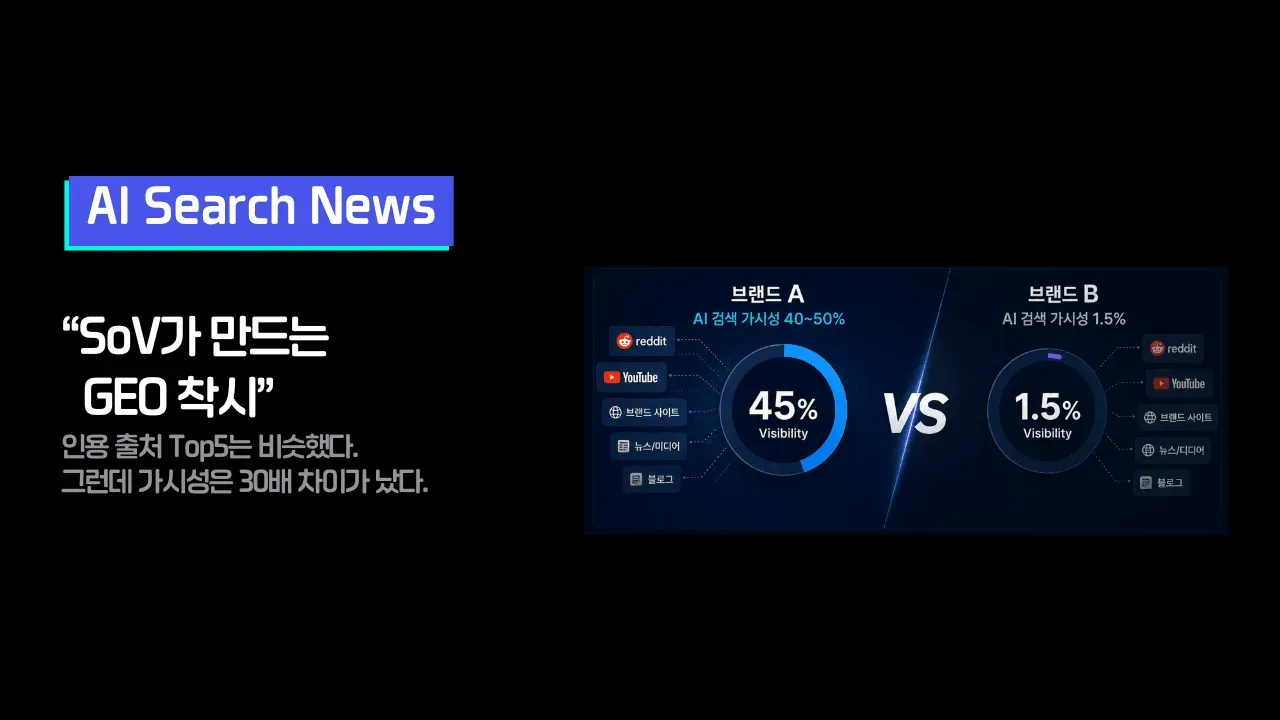
The top 5 citation sources were the same. Yet visibility differed "30x"!
Today's post is about the GEO illusion that small data creates, and the moment a diagnosis becomes a strategy.
1. Same channels, same shares — a report that "looks similar"
Chainshift recently ran a head-to-head analysis of two brands on keywords in the beauty device category. We collected all citation data generated by four engines — ChatGPT, Gemini, Google AI Mode, and Google AI Overview — and compared category leader Brand A with challenger Brand B.
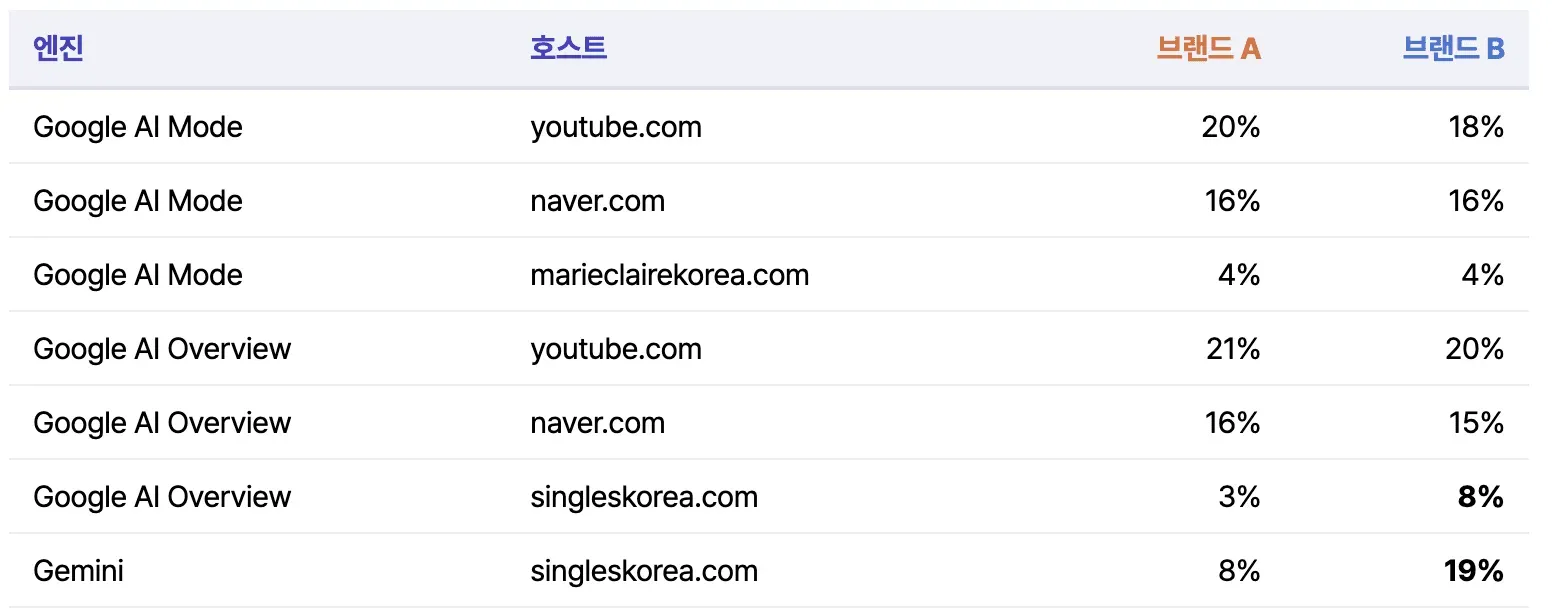
While building the strategy, we opened the SoV metrics. (These are the top 5 citation source hosts you commonly see in GEO reports these days.)
Looking at the table above, the two brands appear to be cited by AI models in a similar way, with the same channel portfolio.
But when we checked actual answer visibility, it was 42% vs. 1.5%.
Although they were cited on the same channels in similar proportions, the probability that their name came up when consumers asked AI differed by nearly 30x.
This contradiction was the starting point of this analysis.
2. Why this illusion happens — three misconceptions created by small samples
The first thing to point out is that the table above is not "wrong" data. The problem is not the data but the base (sample size). This case contains every misconception people most easily fall into when observations are few.
Misconception 1: "Similar ratios mean similar scale"
Looking at the number of citation rows in the same period, on ChatGPT Brand A had 8,512 rows and Brand B had 146. Brand A's 13% for Tistory is 13% of 8,512 rows, and Brand B's 49% for Tistory is 49% of 146 rows. On screen, B's bar looks much longer, but in actual citation counts A is overwhelmingly ahead. A ratio tells you the ranking, not the scale, and if the base is not on the screen, this difference is invisible.
Misconception 2: "146 is enough to make a judgment"
A 49% drawn from 146 rows is a number that swings widely if just a few are missing. Yet in the report it is printed right next to the 13% from 8,512 rows, as an equally confident number of the same size. Weekly or monthly snapshot measurement pushes every brand into this "small-sample zone." But because AI answers are generated a little differently every time, measuring a highly variable target with a small amount of data makes noise read like a trend.
Misconception 3: "If we hold the top 5, we are doing well"
A top 5 report shows only "where you are present." Brand B had zero citations from clinical evidence domains (nih.gov) and only a trace of 1–2% in communities such as Reddit, but these gaps do not exist in the top hosts ranking. Even the structure in which 49% is concentrated on a single Tistory blog is a risk, yet the ranking shows it as an achievement: "#1 secured." In GEO, most of the room for growth lies in the empty places, but with small observations you cannot even identify what is empty.
The three misconceptions have one thing in common: the metrics are not wrong; conclusions are drawn before there is enough data to make those metrics reliable.
3. Looking again with complete data — the three axes that create the gap
When Chainshift split the same dataset again on a complete, row-by-row basis, the causes of the gap that were invisible on the top 5 screen became clear.
① The volume of content that serves as material — number of unique cited content items
The number of individual content items that AI has actually cited.
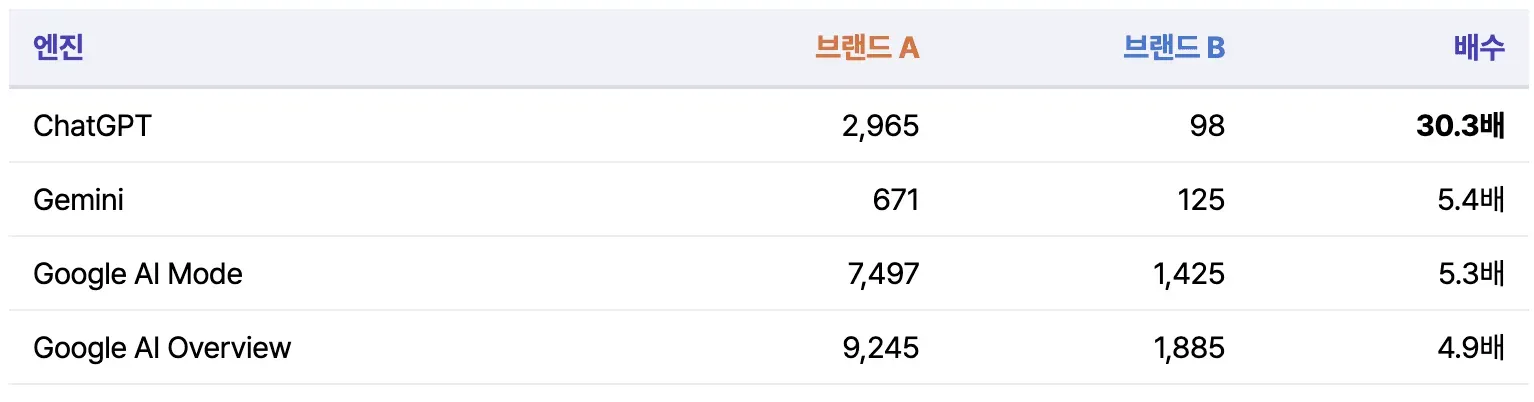
AI picks and cites different content every time it is asked. If one draw box holds 30x more balls than the other, they get drawn 30x more often even if they sit on the same channel. By definition, this metric can only be calculated from cumulative observation. Asking a few questions at a single point in time cannot tell 2,965 from 98, and both brands simply look like "YouTube is #1."
② The number of questions a brand can answer — prompt coverage
Of the 95 measured questions, the number of questions in which the brand has appeared in an answer.
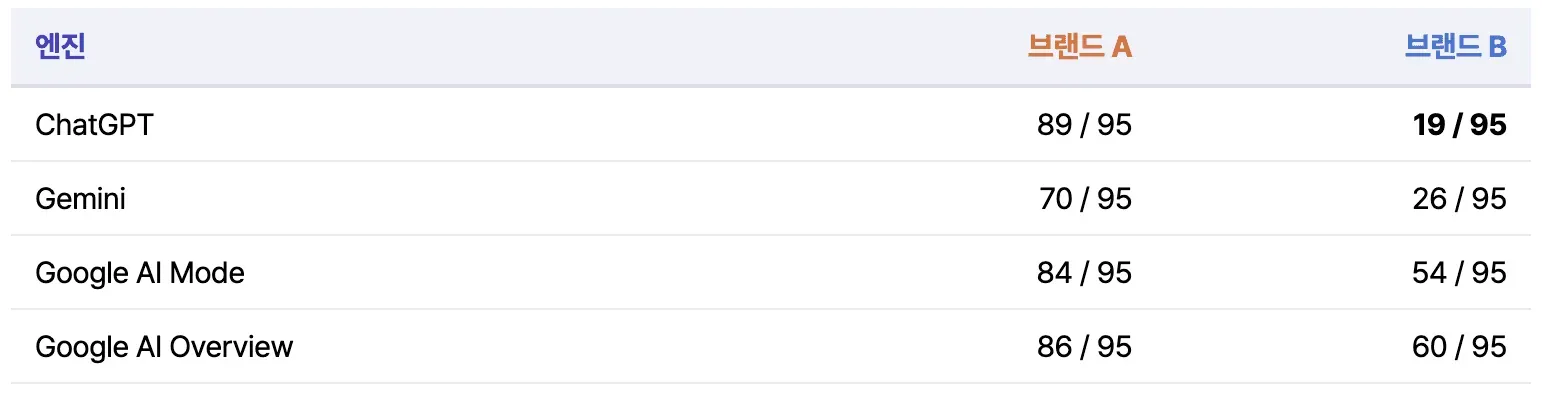
This is the most decisive metric. On ChatGPT, Brand B can appear in only 19 of the 95 questions, and in the remaining 76 questions it is 0% no matter how much you optimize. Its areas of appearance are limited to head, neck care, body, and similar areas. In other words, before content quality even comes into play, B's visibility is structurally capped at 20%.
This ceiling only shows up when the 95-question set is measured repeatedly for each engine. With a 20-question sample, if a few of the 19 areas where B can appear happen to be included, you get the illusion of "a brand that shows up well."
③ Has it been learned as the first choice — solo mention rate
When the brand is mentioned, the share of cases in which it is recommended on its own rather than listed alongside other brands.
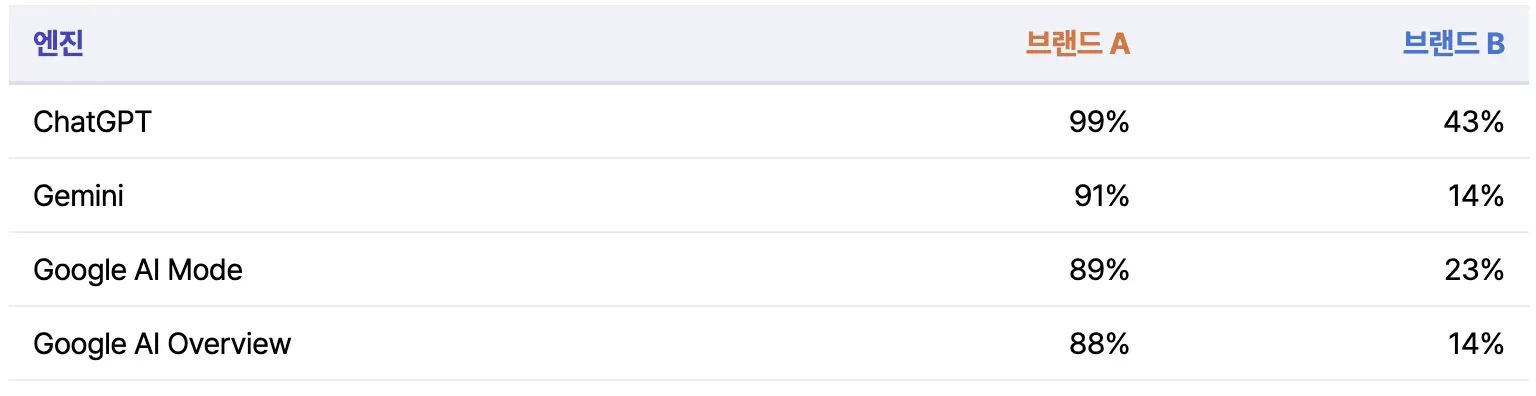
When Brand A is mentioned, 99% of the time it is a solo recommendation. This means that inside AI, "device = Brand A" has effectively hardened into the answer. Even when Brand B is mentioned, it mostly passes by as one item in a list of several brands. One exposure is not worth the same as another. This ratio is also a metric that stabilizes only after enough mentions accumulate, so the rarer a brand's exposure, the less reliable the number from a small sample.
As we have seen, AI answer visibility reflects all three of these factors together, so the final result ends up as far apart as 42% vs. 1.5%. And none of these three appears on a top 5 citation hosts screen, and none of them can be calculated from small samples.
4. The diagnosis becomes the strategy
The real value of a big-data diagnosis does not end at "an accurate picture of the current state." Each of the three axes connects to a different optimization action item, so the moment you identify which axis is the bottleneck, the priorities of the strategy are decided. Taking Brand B as an example, it translates like this.
Misconception 1 → The absolute volume and spread of citable assets
If B has only 98 pieces of content that can be cited on ChatGPT, and 49% of them are concentrated on a single Tistory blog, the prescription goes in two directions.
- Increase publishing volume — AI picks different content every time, so for the name to come up no matter which content is picked, the absolute number of citable pieces has to grow. The ChatGPT ecosystem (Tistory and blog-style long-form), where the gap with A is largest at 30x, is the top place to invest.
- Spread across hosts — The empty hosts identified in the diagnosis become the target list as-is. For B, nih.gov-type clinical evidence (0 citations) and communities such as Reddit (1–2%) were empty. For a brand with clinical and ingredient data, evidence-based content and research publications are the route; for communities, the approach shifts to seeding and UGC strategies.
Misconception 2 → Expanding coverage, that is, expanding "topics"
The list of 76 questions where B is stuck at 0% is itself a content calendar. Clustering the 76 questions shows the usage situations, concerns, and comparison axes where B's content does not exist at all. What is needed here is not SEO touch-ups to existing posts but developing new topics that earn the right to appear in answers, such as facial devices, comparison reviews, and recommendations by price range. If coverage grows from 19 to 50 questions, the ceiling itself rises from 20% to 50% or more. That is why it has more leverage than any other optimization.
Misconception 3 → From "one of the list" to "the answer"
A low solo mention rate means AI knows the brand but does not remember it as the representative of the category. The prescription is strengthening the category association: pick a sub-category where you can build the equation "when you think of ○○, think of B" (for example, head and neck care, where B is relatively strong), and concentrate definition-style content, content that sets comparison criteria, and authority signals such as awards and certifications there. Given the multiplicative structure, securing a narrow area where you can create solo mentions is more efficient than going head to head with A across every category.
In short, the three metrics are the branching points that decide where to spend budget first. If you only look at the SoV ranking, you have no basis for judging which of the three prescriptions is needed, and optimization stays at the generic level of "let's write better content." Once the bottleneck is identified, the strategy becomes specific.
5. Why Chainshift treats GEO as big data
This analysis was possible because we collected about 3 million visibility and citation records from four engines in full.
As we have seen together, the reason Chainshift keeps emphasizing big data is that some metrics simply do not exist with small data.
- Number of unique cited content items → cannot be calculated without cumulative, complete observation
- Prompt coverage → cannot be calculated without repeated measurement of the question set
- Solo mention rate → cannot be trusted without enough mention samples
- Gap structure by engine → the same brand is 30x behind on ChatGPT but 5x behind on AI Overview.
The size and cause of the gap differ by engine, so the strategy must differ by engine too, and this breakdown also requires complete data
The furthest conclusion that weekly, monthly, or short-term snapshot measurement can reach is "the two brands have similar channel compositions." Even if visibility is diverging 30x behind that screen, you cannot see it.
Closing
This case was about beauty devices, but the structure applies to any category. A ratio metric is a number with its denominator removed, and AI visibility is decided in the denominator. If you are receiving GEO reports that "look similar" to your competitors', now is the time to check whether that similarity is real or an illusion created by small observations.